
Visualizations allow you to give visual indicators for your end users and display the data on the reporting page in a visual way.
The process is designed for use within your custom reporting pages but can also be added to a number of baseline FAST reports. Adding Visualizations follows the same principles as adding Hyperlinks. Click here for detailed instructions on adding a hyperlink to your custom reports.
Select the report you want to work with and select the + More Tab, then select Hyperlinks

Click on Add Hyperlink (shown above)
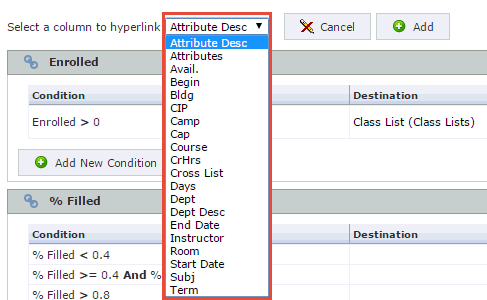
Use the drop-down list to select the column that you want to add the Visualization "to", then click Add:
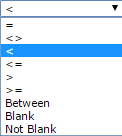
Begin to create your Visualization Conditions which can be based on any of the following:
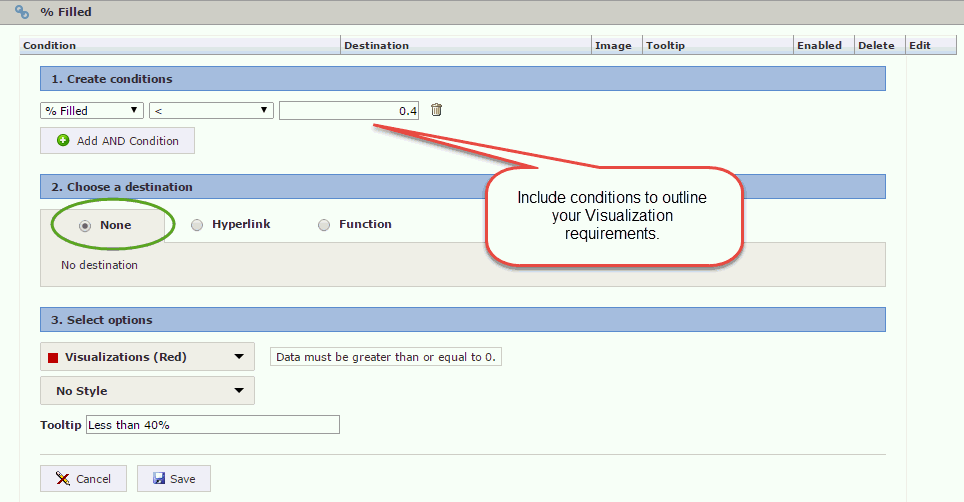
Create your Conditions and choose "None" as your destination page (in other words, the Visualization will be on the reporting page, not take the end users to another page as the Hyperlinks will).
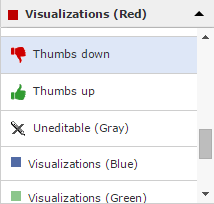
Next, choose a Visualization "image" to use from the drop-down list of options. Note: you will want to use a different Visualization indicator image for each condition that you establish in order to distinguish them on the page.
Next, you can add a "Tooltip" (optional) to give your end users an indication of what the Visualization represents when they hover their cursor over this field.

Next click Save to complete this condition and if necessary, click Add New Condition to add further conditions to this field:

When your conditions are complete, you can review the list and Edit or Delete as necessary. You can also enable or disable any existing conditions using the toggle bar in the Enabled column:

When you are ready to test and view your Hyperlinks, click back on the Filter Options tab and re-execute your query.
The modified column will now display your data using Visualizations and the numeric field will display to the end users as they hover their mouse over each of the Visualization markers.
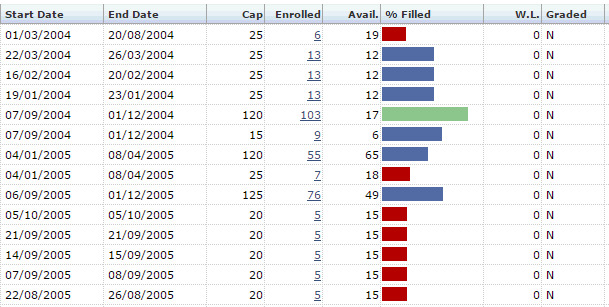
If additional edits are necessary, simply return to the +More tab, select Hyperlinks and from there you can either edit your existing conditions or create new ones. You are able to add multiple Hyperlinks and/or Visualizations to any report. There are some limitations to Baseline reports but most report will allow for the creation of Visualizations on any non-calculated field.