In this sample, I have used the Student Grade as my X-Axis and a total Count of Student ID's as my Y-Axis:

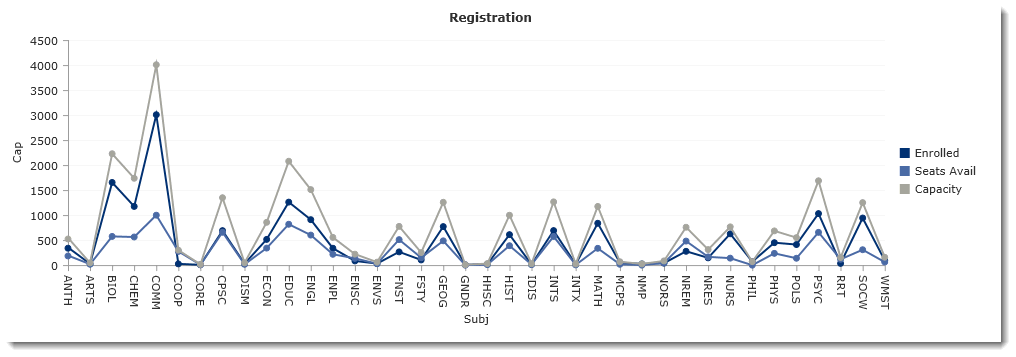
In this sample, I have used the Subject Code as my X-Axis and I have plotted 3 Y-Values side by side. These are: Count of Total Seat Capacity, Count of Total Current Enrolment, and Count of Total Available Seats.

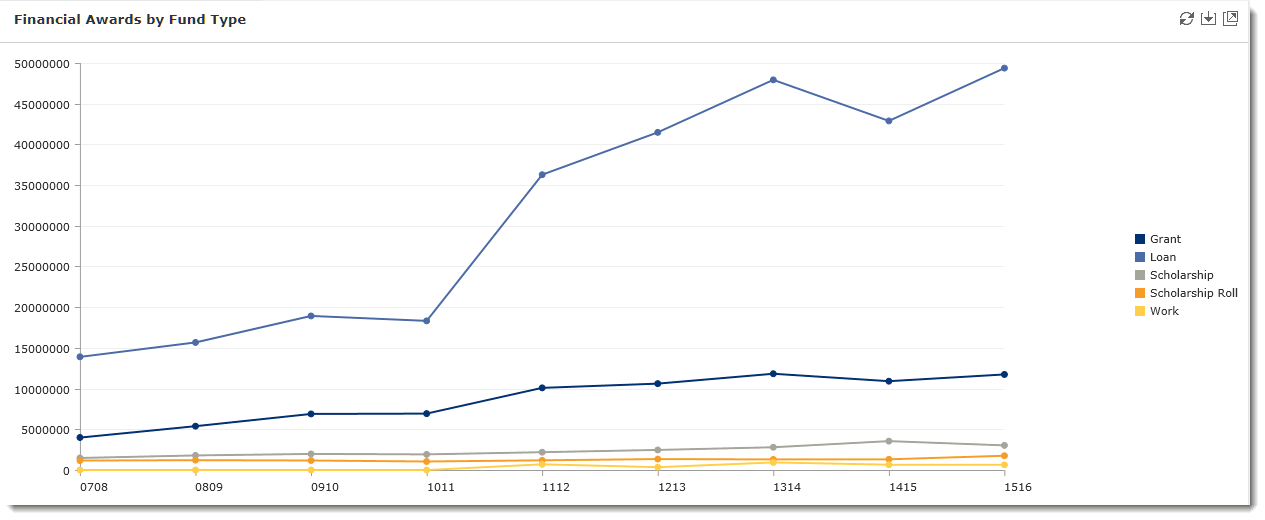
In this sample, I have used Aid Year as my X-Axis, Offer Amount (as a SUM) as my Y-Axis and I have Grouped these values using Fund Type Description:
