 to export
the data into Excel.
to export
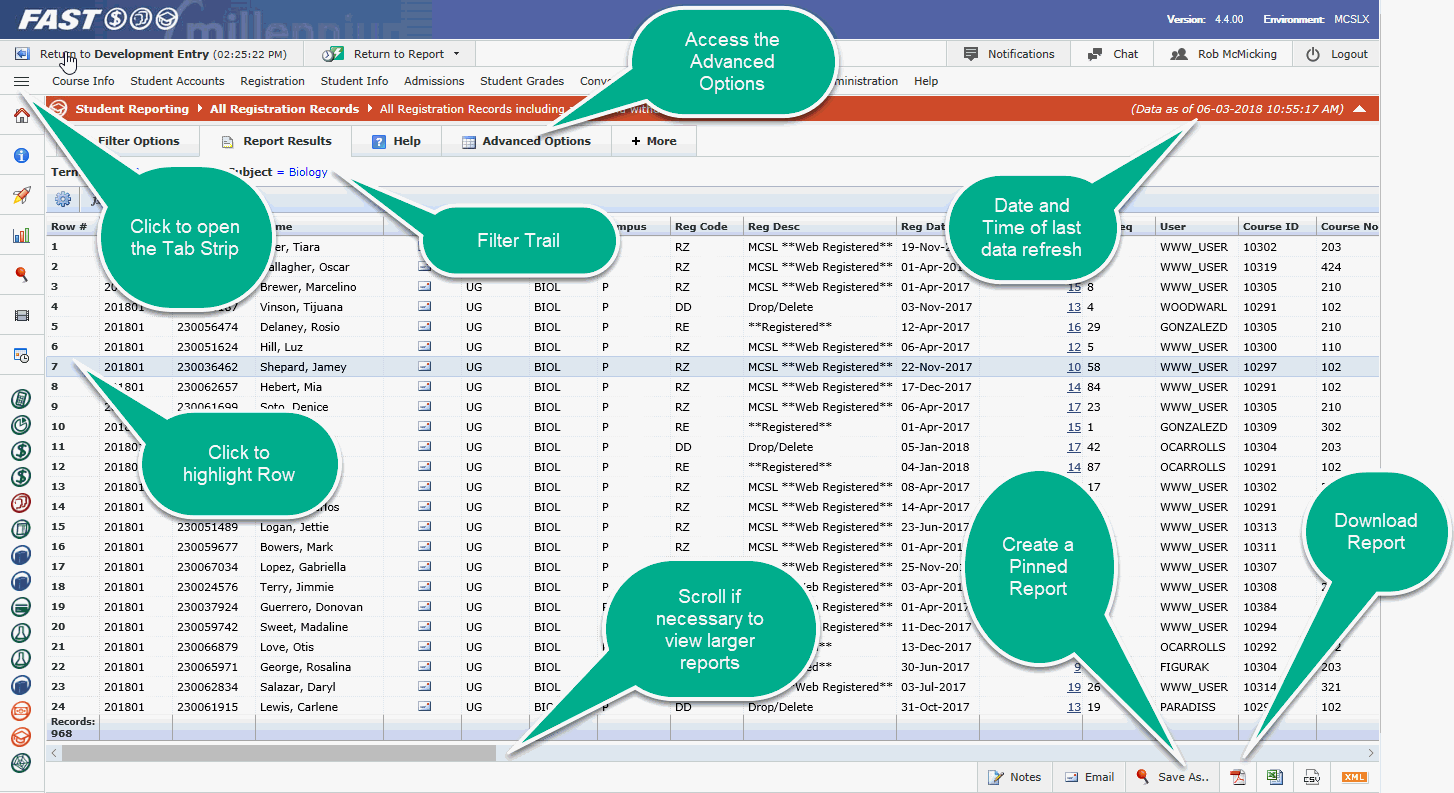
the data into Excel.After you have executed a report, the results will display in the report results view.
The report header provides some information about your report:
The Application that the report is run in.
The Report Title
The Report Description
You can review the current Filter Options and simply click to make a change!
Columns in each report are different, depending on the report requirements. Columns can be dynamically re-sized or re-ordered, sorted and other filters applied.
To highlight a row on a reporting page, either Single Click the Row # (first column) or Double-Click any cell on the reporting page to highlight the entire row for quick and easy navigation and to keep your place on the page. To de-select the row, simply click elsewhere on the report. On data entry pages, you can also hold down your Ctrl Key to select more than one Row; this is useful for deleting a group of records, rather than one at a time. For more information on how to select or isolate rows on your reporting page, please Click Here.
Data that is displayed in blue has hyper linking applied which allows you to drill down into more detailed reports about that data or acts as a short-cut to access additional reports with similar data.
From this view, you can change any of several options to further customize the report results. Consult the Advanced Options for more info!
At the bottom of the page, there are standard options for navigation, saving and exporting the report
Save to Pinned Reports: Click Save to save as a pinned report.
Save as a Dynamic Selection: Click the Dynamic Selection button to begin export.
Export report
to Excel: Click  to export
the data into Excel.
Export Report
to PDF: Click  to export
the data into PDF format.
Export to XML
or CSV: Click either the  or the
  .
.
