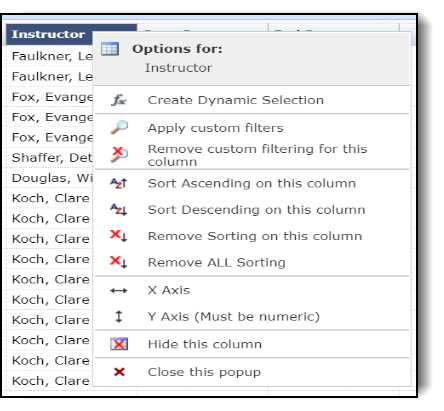
After you run your report, you can click a column title to use the custom filters. With this tool, you can limit the amount of items on the page by filtering on a specific column, sort a column in ascending or descending order, select columns as the X or Y axis for a graph, or hide any column in the report.
Click one of the following for detailed instructions:
Selecting columns for your graph
When applying custom column-level filters, you have the ability to refine data your report will display that cannot necessarily be limited using Filter Options; these are conditions you may wish to apply on the column-level data rather than at the report level. Do apply a column level filter, click on the Column Header (title bar) and select Apply Custom Filters:
![]()


