To create one or more Dashboards, first ensure that you have selected the Dashboard Tab from the Tab Strip. Once selected, you can create as many private Dashboards as you like using the tabular layout. If you are also an application-level Administrator, a Site Administrator and/or a Dashboard Administrator, you can also create Dashboards to be made available for groups of end users on campus. These are known as Group Dashboards.
Once created, all Dashboards can then house any number of charts, graphs and grids based on your Pinned Reports.
If there are currently no dashboards on your page, the Dashboard tab will be empty and look something like this:
If there are already one or more Dashboards on the page, simply locate the + button on the far right hand side of the tabular page.

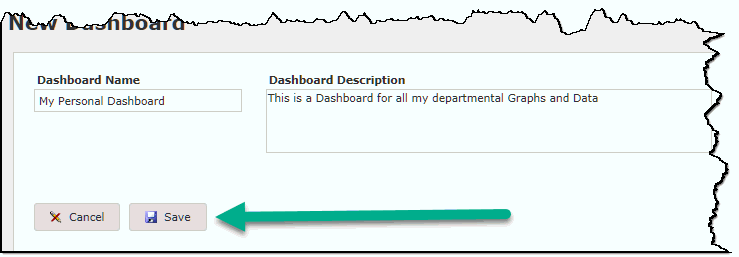
Click the + button to create a new Dashboard. By default, this will auto-label as "New Dashboard" until you provide a new Dashboard Name.
Include a Title and a Description (Optional) and if you are also trying to share this Dashboard with one or more Groups on campus, please move on to the section called Sharing Dashboards. You should also review the section called Dashboard Groups.
Click Save to save your changes and move on to the next step:

Now for the fun part - you're ready to begin Adding Graphs to your new Dashboard.
To edit or manage your Dashboard, please review the section called Managing Dashboard Layout.