When you create your graph, you need to select a column for the X Axis and a numeric column for the Y Axis. Many columns do not have numeric data, however you can apply a Group Function (such as a "count") so it behaves like one and Advanced Options is where you do these tasks. For more information, you can read About Advanced Options.
To use advanced options to set up data for your graph:
A great starting point is to look at your report results and think about what you are trying to graph. It may not make sense or even be feasible to graph the entire result. So what data element(s) do you want to include on your graph?
Once you decide, let's take a look at how you might use the Advanced Options to make it happen using a basic report.
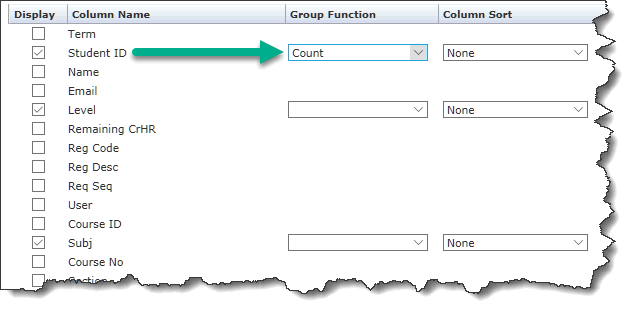
Select the Advanced Options Tab and then (optional) click "Select No Columns" to clear all fields; this is a nice way to clear the page and start fresh:

Once the page is clear, begin adding back in only those fields that you wish to include in your eventual graph (you can always edit this later). Use the Group Functions as necessary to change a list of records to a numeric field, such as a Count of records like in this example:

When you're ready to test it out, click Execute Report to re-execute and review the results.
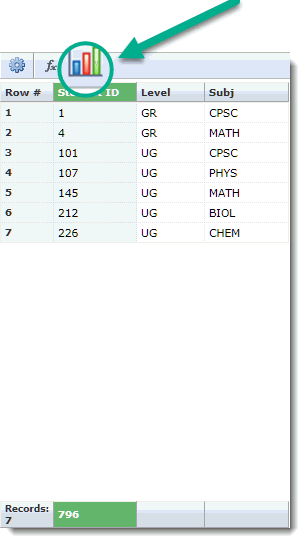
Notice in my example, I have converted 796 Rows (unique records) to a total row count of just 7 by using the Group Functions.
If you're satisfied and ready to graph, click the Graph icon on the toolbar ribbon.

Now we can move on to the regular graphing functionality!