Administrators, Dashboard Administrators and even end users can now add Filters to each Dashboard to refine the view of the graphs on the Dashboard to run with fewer filters for a more concise image.
To add a Dashboard Filter, you need to first have a Dashboard to work with. To get started, please review the topic on Creating Dashboards. You will also need to be familiar with Creating Graphs and how to Add a Graph to your Dashboard.
When you're ready to add a Filter, you should first take a look at the graph content on your Dashboard. What parameters (Filters) are represented consistently on the Dashboard? Are there commonalities between Graphs that would allow you to filter consistently to add value to your results?
When you're ready to apply a Filter (such as Course, Department, Fund Code, ORGN, etc.), ensure that you are in the Edit Mode of the Dashboard you would like to edit. To do this, click Edit Design.
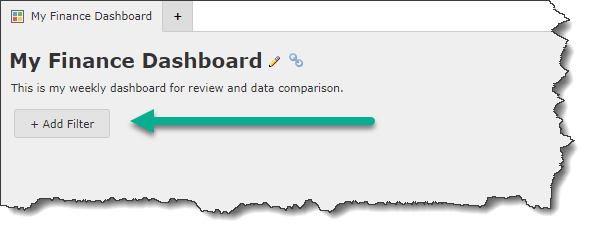
When in Edit Mode, click + Add Filter to begin:
The Add Dashboard Filter worksheet will open, populate some or all of the following fields:
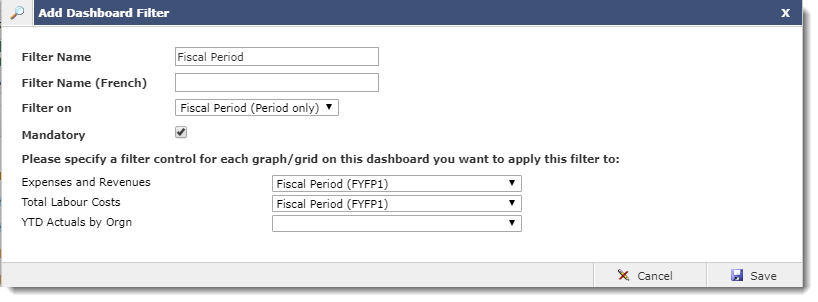
You should include:
A Filter Name (for easy and clear use)
A Value to Filter On: This should be based on that commonality between Graphs on this Dashboard. FAST will list, in the drop-down, a variety of available options based on Filters used in the reports. Select one from the list. NOTE: if the Filter you're looking for is not on the list, there are two options. Administrators can add their own using Dynamic Filter Procedures or you can email Customer Support for help.
Mandatory: select this check box if the end users should be forced to enter a value before the Dashboard loads.
FAST will list all of the Graphs on the current Dashboard and you must select which you would like to add the Filter to. You may choose one or all of the Graphs. Once you select a Filter On value, FAST will auto-fill the next section where it is able to detect the values in the Graphs. To add more, use the drop-down. If the Filter Value does not exist in the report (Graph), it will not be included in the Dashboard Filter.
For best results, you should not leave blank records. If applicable, change the blank records to the value of --Do Not Apply Filter-- so that FAST knows this graph is being excluded from Dashboard Filtering.
Click Save to complete and test.
After you click Save you will be returned to Edit Mode where you can test your Filter and/or add additional Filters to this Dashboard:
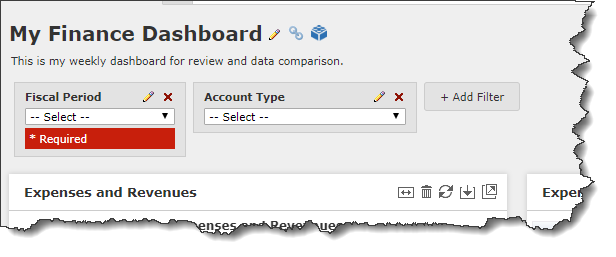
Click View to exit the Edit Mode and test your Dashboard.
Now you're ready to move on to Applying Dashboard Filters and/or Managing Dashboard Layout.
![]()